You've been there. You read a research note and one sentence stops you: "Companies with high gross margins and low receivables-to-revenue ratios consistently outperform in the following month."
The logic checks out. High gross margins signal pricing power. Low receivables mean customers pay fast — cash flow is clean. If you could validate this across the full market, you might have a real alpha source.
So you open Jupyter. Pull up your data API. Start writing.
An hour later, you're still debugging the financial data alignment logic. Two hours in, you're fighting timestamp mismatches at rebalancing dates. Three hours later, your first IC curve appears — and it looks terrible. You can't tell if the factor doesn't work or if your code is wrong.
Four hours later, you give up. The idea joins the 87 other unvalidated hypotheses in your notes.
This is the cost we want to eliminate. Not just reduce — eliminate.
I. What FactorLab does
FactorLab is Peakstone Labs' AI-driven factor research engine. One sentence in, one research report out.
You describe an investment thesis in plain language. FactorLab translates it into quantitative language, writes the Python, runs a three-period backtest across four holding horizons, and — three rounds of AI iteration later — returns a complete research report. You can close the tab after you submit.
II. How it works
Intent parsing
The LLM translates your plain-language thesis into quantitative language: which financial ratios to compute, how to handle point-in-time financial data, how to normalize across sectors, what holding period to target. This step requires genuine domain knowledge — not just grammar. The model has to know that "high gross margin" means (revenue − COGS) / revenue, cross-sectionally ranked, with the appropriate reporting lag applied.
Code generation
From the parsed intent, the AI generates executable Python: factor formula, calculation function, data alignment across financial report dates and trading days, cross-sectional normalization, and factor combination weights. This code runs the actual backtest — the LLM wrote it but doesn't touch the math.
Three-period × multi-horizon backtesting
Looking only at in-sample IC is the most common trap in factor research. A factor can look excellent in-sample and fall apart the moment you move past it. FactorLab splits the data three ways:
In-Sample — the training window. This is where the factor gets its initial score.
Out-of-Sample 1 — first validation. Does the factor generalize beyond the period it was computed on?
Out-of-Sample 2 — the most recent data. Is the factor still working now?
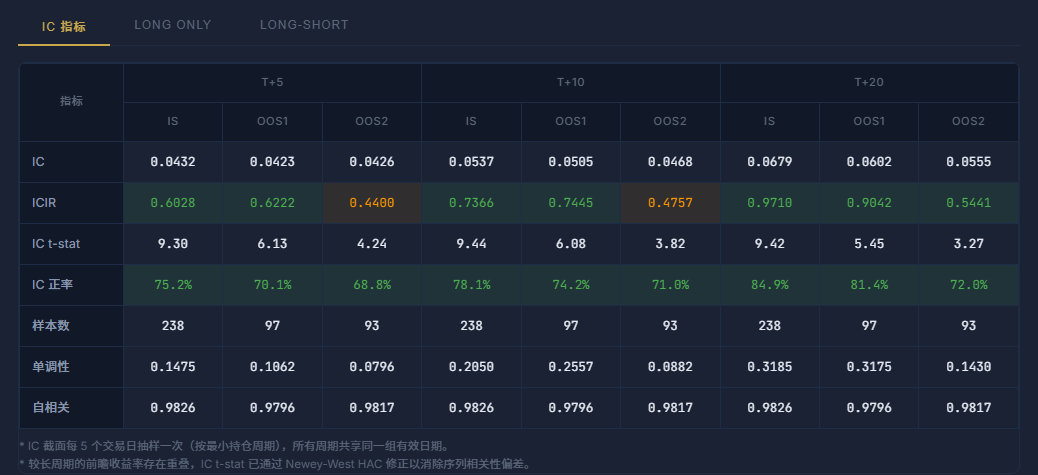
Each period runs across four holding horizons (5 / 10 / 21 / 63 days). Metrics per combination: IC, ICIR, quintile returns, long-short Sharpe, max drawdown, and turnover. The scoring formula down-weights in-sample performance to penalize overfitting:
Factors that collapse out-of-sample get penalized automatically.
AI self-evaluation and iteration
Most tools stop after the backtest and hand you a table. Figuring out what went wrong and what to try next is left entirely to you — and that's usually where the investigation dies.
After each backtest, FactorLab's AI reads its own results and writes a diagnosis. Specific, not generic:
"This round's factor reached IS ICIR of 0.18 with good quintile monotonicity. But OOS1 ICIR decayed to 0.06, and the top/bottom spread nearly disappeared in OOS2. Likely cause: the gross margin percentile ranking created thresholds too sensitive to sector-cycle shifts. Next round: replace the static percentile rank with a year-over-year rate of change — capturing margin improvement rather than absolute level."
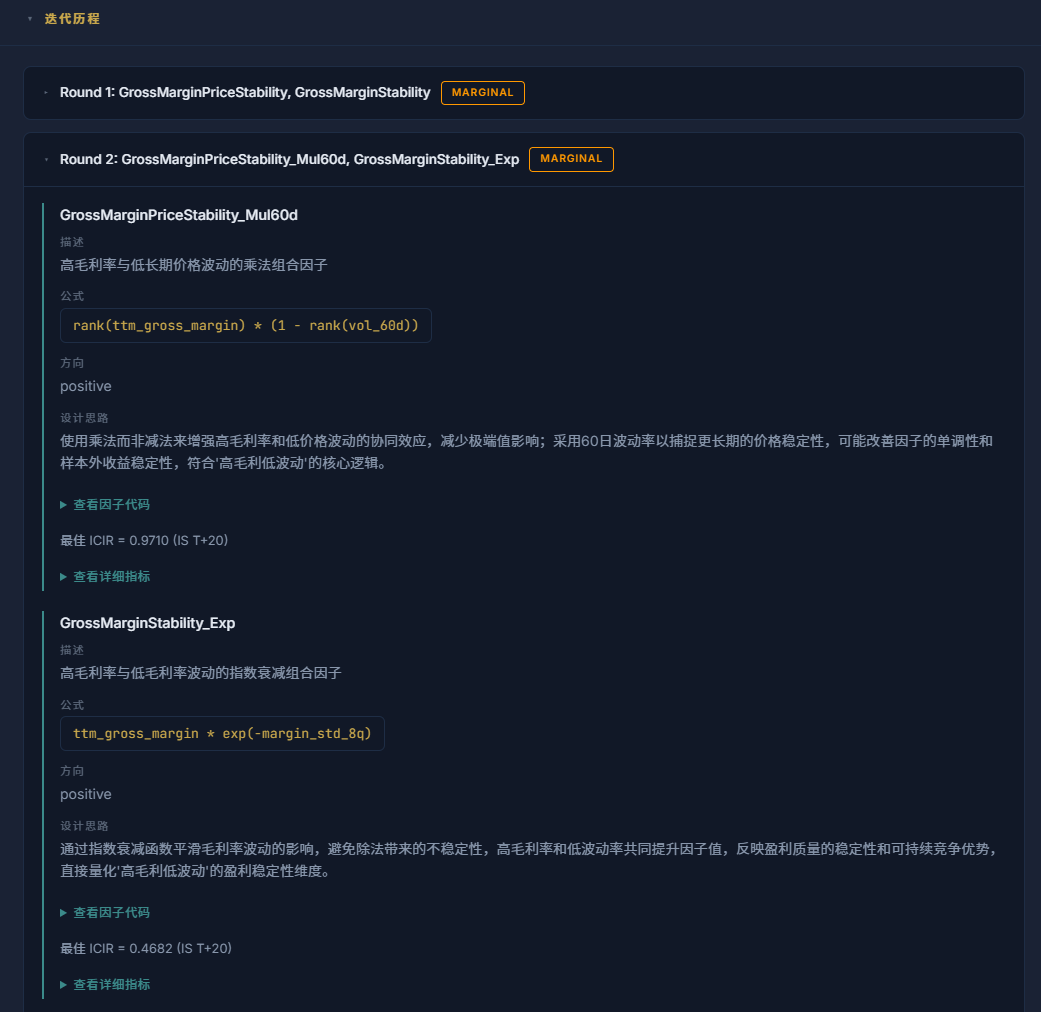
Then it acts on that assessment. Three rounds by default: an initial attempt, a failure analysis, and a revised factor built from what that analysis actually found. The third round tends to be the most useful, because by then the model has seen two iterations of real data.
Full research report
The AI assembles everything into a structured report: SOTA factor name, weighted ICIR, long/short Sharpe, iteration count, and total runtime up top; then the full three-period × multi-horizon metrics, equity curves, candidate factor comparison, and every round's AI evaluation with the reasoning behind each change. You get the answer and the full trail of how it got there.
III. Getting started
Two things we added after launch, both from direct user feedback:
Seed idea cards. The blank input box turns out to be its own obstacle. When you can type anything, it's harder to type something. The submission page now shows three randomly drawn hypothesis cards — things like "Low-PB broken-value stocks with a mean reversion alpha" or "8-quarter high-and-stable ROE as a quality signal." Click one to populate the input, edit it to fit your view, or ignore the cards entirely. There are 50+ in the pool, covering valuation, quality, growth, momentum, volatility, cash flow, and R&D factors. Refresh the batch if none of the three land.
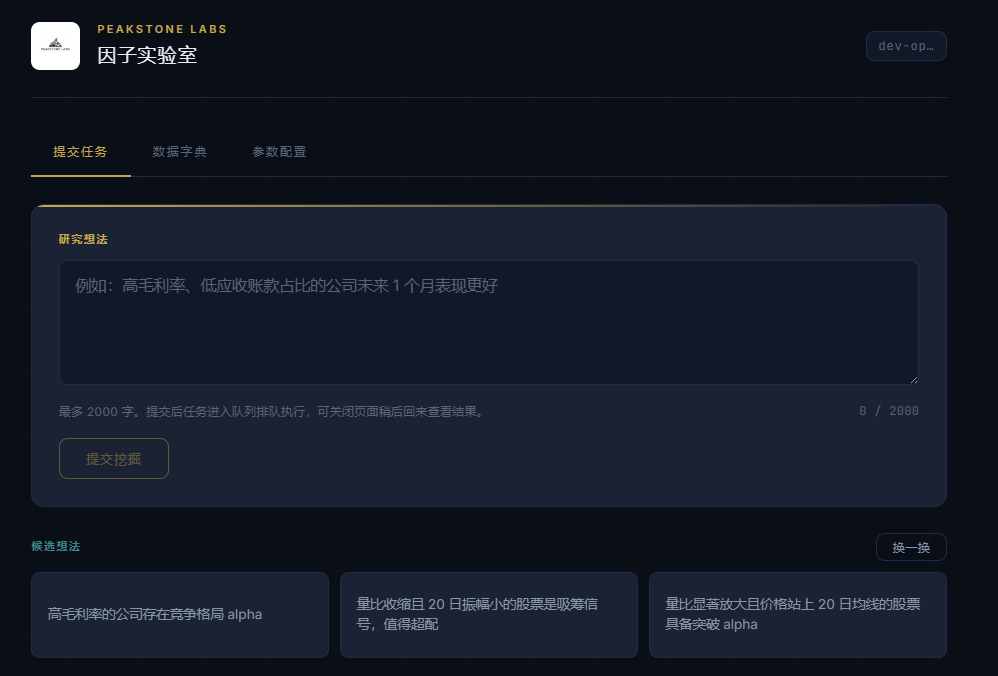
Entry via WeChat. FactorLab is currently accessible through the Peakstone Labs WeChat official account. Search for Peakstone Labs on WeChat, send any message to receive your entry link, enter your research idea, and step away. A notification arrives when the report is ready — or check your task history on your next visit. (Rate limit: 5 tasks per account per day. A direct web interface is on the roadmap.)
IV. Why now
The honest answer: two things became true at the same time.
First, LLM code capability crossed a threshold. Three years ago you could ask a model to write a factor formula. But reading your own backtest results, spotting where a factor actually breaks, and writing a fix that addresses the right thing — that's a much harder problem. Current models (Claude Opus 4.6+, GPT-4o-class) can actually do it. Earlier ones couldn't, and it showed.
Second, the data infrastructure matured. FactorLab runs on QuantDataHub, Peakstone Labs' in-house data layer: 28 MCP tools, 23 data categories, point-in-time financial data, four-tier caching. Without that layer, each backtest iteration would be fighting raw API rate limits. The iteration loop only works because the data layer is fast and stable.
A factor research report used to take a quant team a week. Now it takes minutes — and starts with a sentence you type.